When your Mintaka DUO™ / STAR™ is connected to a computer by a USB cable you can use MintakaCommander to manipulate the instrument, plot graphs, extract data, update the firmware, and other operations. You can, for example:
- View versatile, interactive graphs of stored data, including a unique trend analysis feature.
- Show a full-screen plot of the pressure on your computer that updates every minute.
- Region zoom the graphics to show the slightest change in pressure.
- Download user-selected data to a csv file to view off line. (Valuable for mining, medical, and other applications that require an archived record of pressure history.)
- Create and access logged entries.
- Display information on the state of the DUO / STAR.
- Read and set various parameters (units, time, timezone, etc.).
- Check or set the DUO / STAR’s high-accuracy internal clock.
- Check for latest firmware and update it automatically if needed.
- Connect directly to the DUO / STAR and run commands from the included terminal window (without the need for an external tool).
- Configure NMEA output to read pressure in other instruments and software programs.
Getting Started
Step 1. Download MintakaCommander
Download the appropriate version from:
Windows version Download MintakaCommander.exe
Mac version Download MintakaCommander.zip
The PC version requires Java version 1.8 or later. The latest version is 1.8 and is available from Oracle.
Step 2. Run MintakaCommander
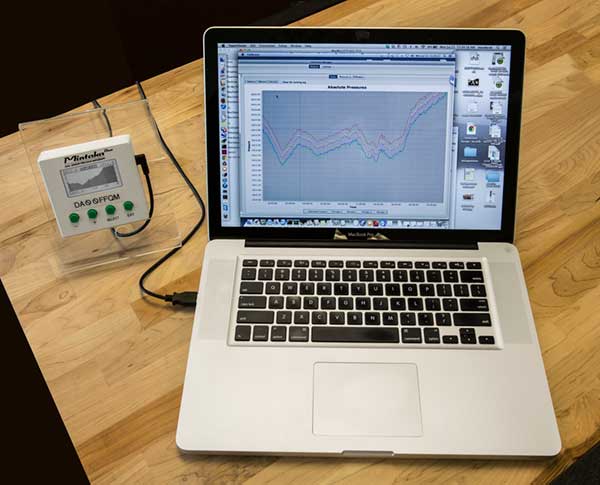
With your DUO / STAR connected to the computer with the USB cable, view the browser Downloads folder and run (double click) MintakaCommander.
It will open with a window like the one below, along with a notice that it is loading data from the DUO / STAR to the computer. This will a take a few seconds for the first time, depending on how long the instrument has been running, but subsequent sync operations are much faster as it just has to add the new data. Then it will automatically display a graph of the data over the last week. This time period can then be changed as desired.
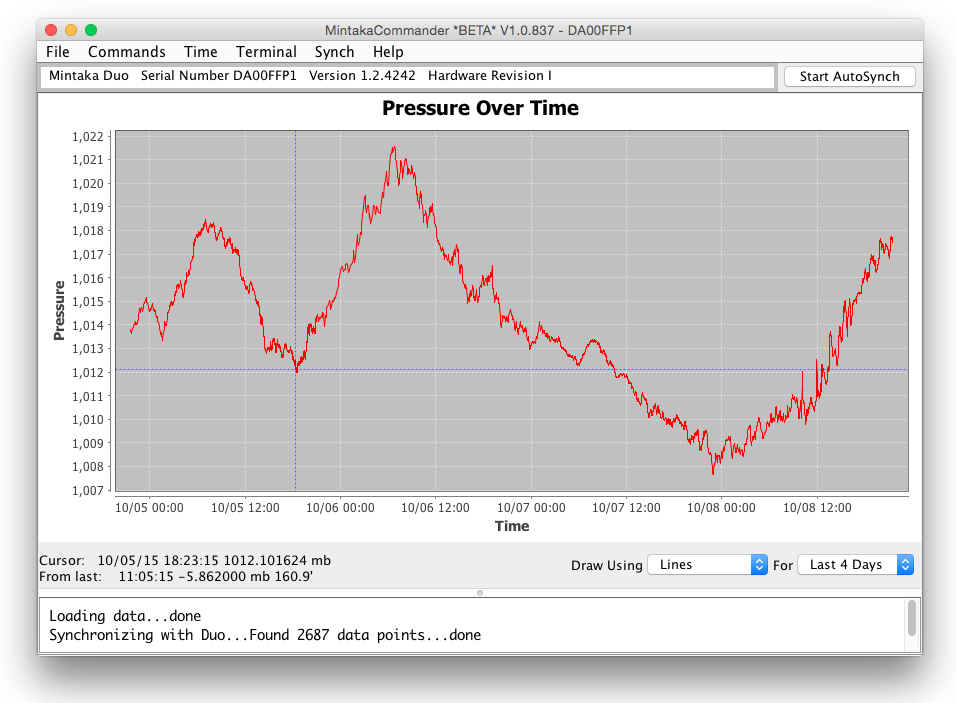
Available barometer controls, readouts, and operations are available from the menu bar. They are outlined below.

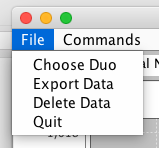
Choose Device. With multiple units attached to the computer, use this to select the one of interest. (Once data has been synced with the computer, you will then have the later option to view and analyze this saved data without the DUO / STAR connected to the computer.)
Export Data. Enter start and end dates or graphically select (click start and end points) a region of data for export to csv file for analysis or archive elsewhere.
Delete Data. Enter start and end dates or graphically select a region of data to delete. Valuable since the DUO / STAR stores up to two years of data.
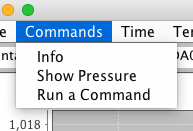
Info. Shows current state of the DUO / STAR. See sample.
Show Pressure. Displays at the bottom on the page: current time, pressure, sensor temperature, difference between sensors and calibrated difference between sensors.
Run a Command. Lets you run any of a number of commands. The command h gives a list of commands. See sample.
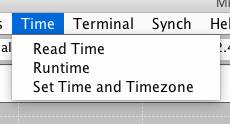
Read Time. Displays the clock date and time according to the DUO / DUO+ / STAR’s internal clock. Also displays the error relative to computer time along with the time period since it was last set. This assumes the computer has correct time, which is likely the case if it is newish and connected to the Internet. See notes on finding accurate time.
Runtime. Shows the total time the DUO / STAR has been running along with the time period since the last power up.
Set Time and Time zone. Sets the DUO / STAR to the computer time and time zone. Note it does not ask you to confirm this; it just does it, so best to check the Read Time to see if this is needed. You can adjust the time by a given number of seconds with the command ST, and also set the time zone without changing time with command SZ. See finding accurate time to be sure you need to change it. The DUO / STAR should be a very accurate clock.
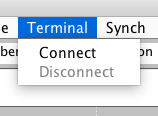
Connect. Connects the DUO / STAR to your computer via a command or terminal window, active at the bottom of the window. You can issue commands in that window or monitor autosample output.
Disconnect. Closes the terminal connection.
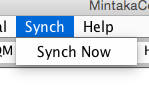
Synch. Synchronizes the data in the DUO / STAR with that stored in your computer. After the initial sync, only new data will be added.
There is also an Auto Sync option on the right-hand side of the menu bar that you can set to any interval that will automatically update the data and display it in the graph for a live display of pressure accumulation.
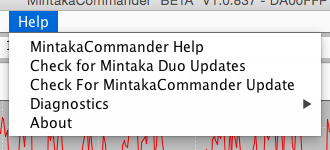
MintakaCommander Help. Includes help notes on these functions. (under construction)
Check for Mintaka DUO™ / STAR™ Updates. This checks your instrument for latest firmware version and allows an automatic update (connected to Internet) along with a brief note of the changes being added.
Check for MintakaCommander Update. Checks online to see if you have the latest version of this app and offers the option to download it.
Load Firmware File. This is another way to update the firmware by first downloading the file to your computer then loading it from your computer.
Diagnostics. Displays a file of information that could be useful in evaluating the performance of the instrument as needed.
About. Displays the version number of the MintakaCommander application.
![]()
Graphic display manipulation
• Region zoom with left click and drag (upper left to lower right).
• Right click for zoom options.
• Ctrl+left click to drag pan (PC). Option+left click (Mac).
• Click a data point to read its value in the status line below the graph.
• Click a second point to see change in time and pressure from the last click.
(The last number in the display is the pressure change between clicks expressed as an equivalent elevation change in feet (‘), if you might be using the instrument as an altimeter.)
Samples of Mintaka DUO™ Commands
Information command ( i )
Mintaka DUO™ Recording Barometer V 1.2 Rev I build 4210 serial number DA00FFP1, 10/07/15 20:32:00 UTC-7
Started 10/07/15 20:23:08 UTC-7, running for 0:08:52, total runtime 173 d 0:59:31
Sample files
Id Collection Interval Size Samples Last Entry UTC-7
0 0:00:15 750 750 10/07/15 20:31:45
1 0:01:30 750 750 10/07/15 20:31:30
2 0:03:00 750 750 10/07/15 20:30:00
3 0:06:00 750 750 10/07/15 20:30:00
4 0:12:00 750 750 10/07/15 20:24:00
5 0:24:00 750 750 10/07/15 20:12:00
6 0:48:00 750 750 10/07/15 20:12:00
7 2:00:00 750 750 10/07/15 19:00:00
8 6:00:00 750 540 10/07/15 17:00:00
9 12:00:00 750 270 10/07/15 17:00:00
10 1 d 0:00:00 750 135 10/07/15 17:00:00
Samples collected 6945, used 84% of file storage
Barometer State, Initialized
hourUnits 24, timeZone UTC-7, pressureUnits mb
elevationUnits Feet, barometerCorrectionType Elevation
show running avg 0, elevation 0 (0.0), station pressure offset -0.00
verbose No, samples per second 1.0, contrast 97, supply voltage 4.67
Led Off running average 12 baudrate 57600
AutoSampling is not active
Factory schema version 1, User schema version 1
Sensor Manager
Calibrated pressure no elevation correction 1009.3 filter ‘Averaging’
Sensor 0 temp 82.8 filtered pressure 1020.5 raw 1020.5
Sensor 1 temp 81.5 filtered pressure 1020.5 raw 1020.5
Sensor difference temp 1.3 pressure 0.06
Help command ( h )
Mintaka DUO™ Recording Barometer
AS – autosample command, ‘as <frequency in seconds> {MDA | TURBOWIN | XDR}*’
The ‘*’ above indicates the items within the {}’s can occur 0 or more times
The option(s) chosen will result in the output below:
MDA $WIMDA,<sea level pressure in inches of HG>,I,<sea level pressure in Bar>,B,,,,,,,,,,,,,,,,*<checksum>
TurboWin <station pressure in mb>,<sea level pressure in mb>,<3 hour pressure tendency>,<WMO tendency characteristic code>*<checksum>
XDR $WIXDR,P,<sea level pressure in Bar>,B,BARO,*<checksum>
ASQ – quit output from the autosampler
CF – clear file ‘cf <fileId>’, <fileId> is 0 to 10
CL – clear log entries
D – dump records ‘d [<fileId> [<count>]]’
<fileId> is 0 to 10, or -1 for all files
DA – dump running averages
DEV – dump/clear event log, if arg is T event log is cleared ‘dev [T]’
DL – dump log entries with Synoptic samples ‘dl [<count>]’
DM – dump machine readable data, ‘dm <command>’, ‘dm h’ for help on commands
DP – Dump pressure, prints timestamp, pressure, temperature, pressure difference
and calibrated pressure difference ‘dp [mm/dd/yy hh:mm:ss qid]’.
DPR – Dumps pressure directly from the sensors.
Prints pressure, temperature and pressure difference.
FL – transfer to firmware loader
H – this info
I – print barometer info
LE – log a pressure entry
RESET – factory reset
RESETH – clear history
SA – set/read running average entry count ‘sa [12|24]
SB – set/read baud rate ‘sb [1200 | 4800 | 9600 | 14400 | 19200 | 28800 | 38400 | 57600 | 115200]’
SC – set/read LCD contrast 0-100
SD – set data: ‘sd mm/dd/yy hh:mm:ss qid newdata [count]’
SE – set/read elevation: ‘se {E|P} xxxx.x’
SN – read serial number
SO – set/read offset: ‘so xxxx.x’
SS – set/read sensor: ‘ss {0|1} {0|1}’
ST – set/read time: ‘st [[mm/dd/yy] hh:mm:ss] | [+/-<seconds>]’
SU – set/read units: ‘su {12|24} {mb|hPa|inHg|mmHg|inH2O|cmH2O|kPa} {feet|meters}’
SZ – set/read timezone ‘sz tz’
Command Examples
d 4 100 will display the latest 100 entries from the ID 4 file (12-minute intervals) of pressures
st 4 will increase the clock time by 4 seconds
Note any set/read command will read the values without changing them if no argument is given.
Thus the command SU might show: Hours 24 Pressure units mb Elevation units Feet